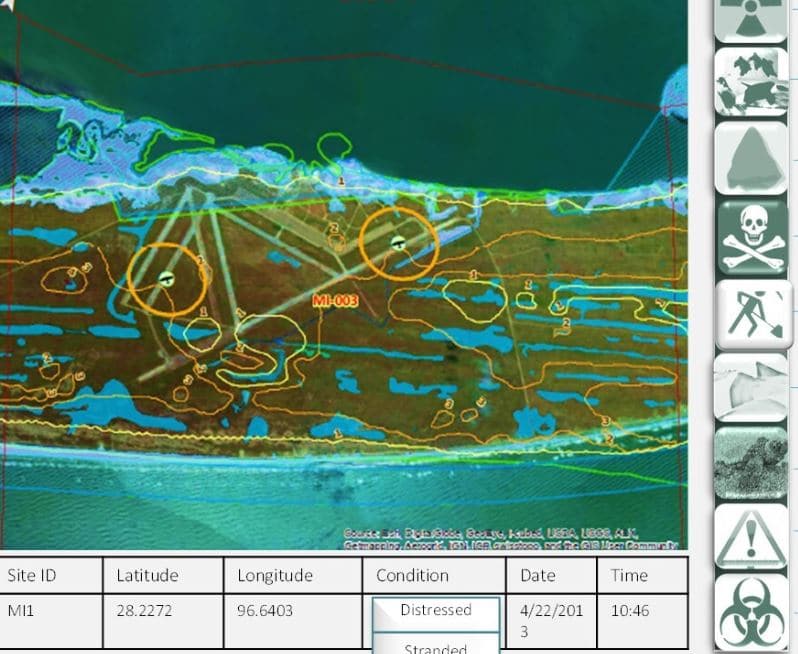
A geographic information system, or GIS, is used to capture, manage, analyze and visualize data that has a geographic location. Roads, parcels, utilities, assets, environmental features and demographic information can all be represented as layers on a map.
OcuMap is not a replacement for GIS. It is a visual documentation platform that helps teams organize the photos, 360 imagery, video, point clouds, drawings and documents that explain what a place or asset actually looked like at a particular time.
What GIS is best at
- Authoritative spatial datasets and attributes
- Layer-based analysis
- Queries and geoprocessing
- Cartography and thematic mapping
- Enterprise asset and geographic databases
What visual documentation adds
A GIS point may tell you that a valve, sign or structure exists. A visual record can show its visible condition, surrounding context, access constraints and what changed between site visits. That context is often difficult to capture in attribute tables alone.
How the two can work together
OcuMap can display location-based information supplied by the user, including KML, KMZ, GPX and CSV data, alongside GPS-based photos and video. Teams can use existing GIS or survey data as the authoritative location source while using OcuMap as the visual evidence and documentation layer.
Historical imagery and comparison
GIS is excellent for tracking changes in structured data. OcuMap extends that idea to the visual record. Documentation from the same location can be compared side by side across dates to help teams understand visible change.
Use the right system for the right job
If you need spatial analysis, network tracing, survey control or authoritative asset management, use the appropriate GIS or engineering system. If you need a connected visual history that brings together imagery, point clouds, drawings and project files, OcuMap fills a different role.
Start documenting with OcuMap →
Practical checklist
- Start with the business or project question, not the tool.
- Identify which source is authoritative for location and dimensions.
- Keep capture date and spatial context with the record.
- Use measurement only within the accuracy limits of the source.
- Preserve originals for future reuse.
- Connect each resource to the relevant OcuMap project, solution or Platform page.
Related resources
Common questions
Is OcuMap a GIS replacement?
No. GIS remains the right tool for geospatial analysis and authoritative spatial databases. OcuMap complements GIS with visual documentation and project context.
Can GIS data be shown with imagery?
Yes, common location-based files such as KML, KMZ, GPX and CSV can provide map context alongside visual records.
Why keep both systems?
GIS answers structured geographic questions; visual documentation shows what the place actually looked like at a specific time.